Data from the August 20th, 2005 launch of LV2
Hey everyone. I'd like to see the analysis of the LV2 data to end up on this page. The raw data is currently attached below. Here's some of the things I'd like to see right away:
- Extract the pressure message
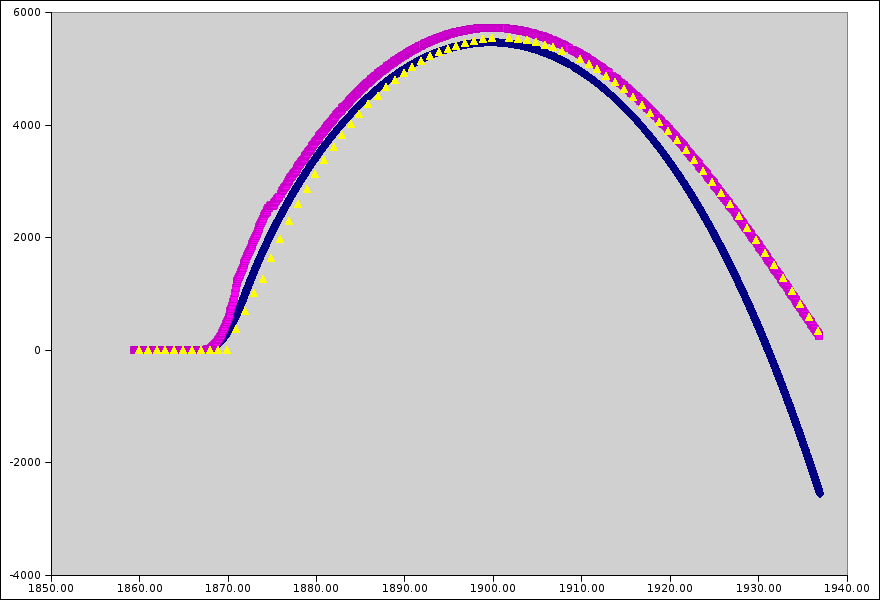
- Plots of the raw pressure, pressure in kPa, pressure altitude, and pressure velocity (dP/dt).
- Plots of the raw Z axis accelleration, velocity, and position (using very simple integration).
- 3D plot of GPS position, 2D plots of GPS velocity
Some of the questions we want to know: how high did we go? what was our fastest speed? When did we break the sound barrier?
2005/08/23: Eric and Andrew
Apogee detect
We looked for the first REC_REPORT_PYRO message in the received data stream, and it looks like the first message was right at apogee... so hooray, the problem was not the pyro's firing early... or, terribly terribly late. :)
DTMF Tones
We saw the arming DTMF tones and the desperate 2m recovery node commands towards the end of the flight.
Pressure data
We made a gnumeric spreadsheet with the extracted pressure data attached below. During the entire flight, only 11 packets were dropped. Wow! Note that the pressure velocity is really, really noisy because of the noise on the last bit of the ADC (which is multiplied by 10 because of the 10 Hz data rate). So we smooted it using an exponential filter (0.8,0.2) to get a more reasonable graph. The smoothed velocity is still weird around mach, so we ignored that. According to the pressure data:
- Apogee was 5,731 m AGL (18,805 ft AGL)
- Maximum velocity was (from smoothed pressure velocity data) 716.5 m/s (1,602 mph)
- Velocity at impact (from smoothed pressure velocity data) was more than -250.7 m/s (-561 mph)
GPS packets
Eric parsed the GPS packets from the flight computer (not the raw GPS UART stuff) and put them in a gnumeric spreadsheet (see below). Only 2 of the FC's GPS packets were dropped.
- Apogee was 6,915.3 m MSL (5,542 m AGL) (22,688 ft MSL (18,182 ft AGL))
- Maximum velocity was 376 m/s (841 ft); HOWEVER, the GPS loses lock during boost because of the > 8g acceleration.
- Velocity at impact was more than -236 m/s (-528 mph).
IMU Z
Eric started parsing the IMU Z values, and a gnumeric spreadsheet is provided. To reduce the quantity of values so gnumeric would touch it, "uniq -W 1" was used on the set of IMU Z text, dropping all values except the first per timestamp.
Note major weaknesses in Eric's plot:
- The spreadsheet doesn't handle the flipping over or post-flipping-over values properly, resulting in over-reported speeds after that.
- Dropping packets gets us a lot more noise that we could avoid by averaging per timestamp and using the same math afterwards (graphing stddev per timestamp could also be interesting).
Andrew used gnuplot to plot the entire Z dataset. This produced some very interesting results during boost, where acceleration spiked at interesting times. The spikes occurred mostly within a single timestamp, and it didn't appear to be bit flipping (values during descent appeared sane).
Even this limited data was interesting:
- Entire timestamps are missed. This is probably a result of a whole UDP packet being dropped (A UDP packet of the size I see on the network could hold around 87 CAN packets, while there are ~25 IMU accel values per timestamp).
- The jump from ~-1G to the over -8G boost took around .02 seconds.
- Minimum IMU acceleration value (smoothed) was around -12.3G, maximum smoothed was around 2.4G.
- According to the uniq-ed IMU Z values, the IMU Z was within COAST_IMU range (-1G,1G) for only single timestamps (.01s) during the transition from boost to drag.
- According to the uniq-ed IMU Z values, COAST_IMU should have triggered a bit before and a bit after apogee, but the longest stretch was in about a 10 second window around apogee. Noise likely shortened these stretches, and picking apart the FC_REPORT_NODE_STATUS will be necessary to find out when it was triggered.
Link Quality
Eric parsed the FC_LINK_QUALITY packets and put them in a gnumeric spreadsheet (see below). Smoothing was done with an exponential filter (.8,.2) as before.
Brief launch timeline:
- 1859.40: Request of ?ArmedState
- 1867.42: Beginning of boost (IMU Z)
- 1871.00: (approximate) entry of mach? (IMU Z, pressure)
- 1872.08: Boost ended, entering drag (IMU Z)
- 1874.80: (approximate) exit from mach?, dip in pressure for ~.3s.
- 1899.87: apogee at 5731.75m AGL (pressure)
- 1899.90: FC Fire pyro #1
- 1900.07: Pyro 1 fires (.10s)
- 1900.91: FC Fire pyro #2
- 1901.07: Pyro 2 fires (.08s)
- 1901.80: apogee at 5,542m AGL (GPS)
- 1904.90: Fire pyro #3 (FC?)
- 1904.95: Pyro 1 fires (.10s)
- 1905.15: Pyro 3 fires (.10s)
- 1905.94: Pyro 2 fires (.10s)
- 1907.40: Rocket has flipped over? (exponential (.95,.05) smoothed IMU Z accel > .5G)
- 1907.91: Fire pyro #4 (FC?)
- 1908.04: Pyro 4 fires (.10s)
- 1926.81: DTMF "#281" completed
- 1926.96: Pyro 1 fires (.10s)
- 1933.72: DTMF "#282" completed
- 1933.86: Pyro 2 fires (.10s)
- 1936.51: DTMF "#" entered.
- 1936.69: Last GPS datapoint from rocket (FC)
- 1936.91: Last data from rocket
Total flight time: 69.49s (32.45s boost to apogee, 37.04s apogee to last communication)
- rocket-all-height.png:
Attachments: