Introduction
We have a huge amount of telemetry data from the 2005-08-20 launch, and we'd like to glean as much utility from it as we can. Some early analysis and comments on what information we're interested in were recorded here (but should be merged into this page).
That telemetry has two major challenges. It is formatted in 16-byte
binary records, which doesn't let us use standard text-processing tools
like grep or awk. Also, we rebooted the flight computer several
times while it was still on the launch tower, resetting to 0 its
internal clock, and the log contains each of those intervals
concatenated together.
The raw captured data is in Rocketview 20050820.log.bz2. But since nobody wants to deal with that, we've been trying to create a textual dump of the telemetry. Initially, Jamey built a Haskell program for this purpose, and Larry made a valiant effort to complete it.
That didn't work out, so Jamey built a quick Perl script called dump. You can fetch the bzip2-compressed text dump.
Another script in the same repo, called mkcsv, produces a CSV (comma-separated value) spreadsheet of selected sensor measurements. However, there's too much data there for either Excel or OpenOffice to handle, which means that if you want to use those tools for data analysis, you probably need to preprocess the CSV file somehow first.
Results
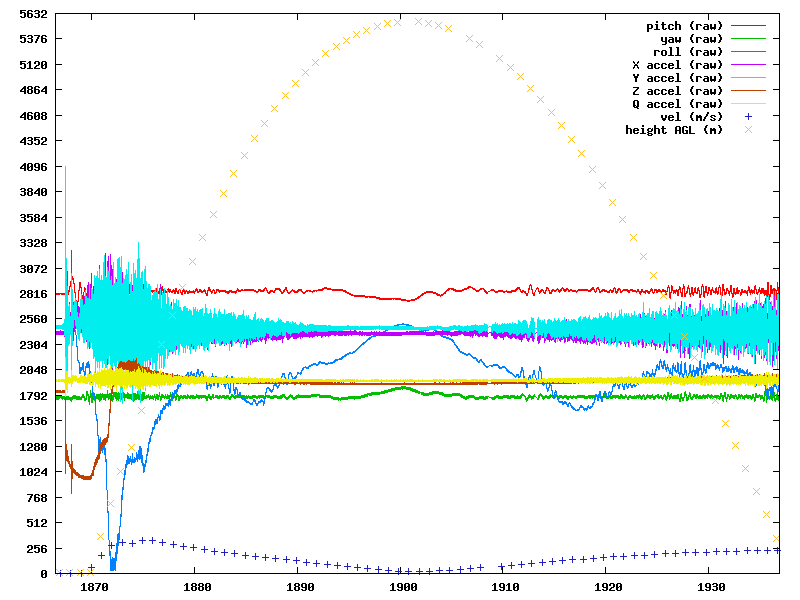
We have some preliminary telemetry plots. Here's one containing the raw measurements from the IMU (three gyros and four accelerometers), and some estimates from the GPS (speed and altitude).
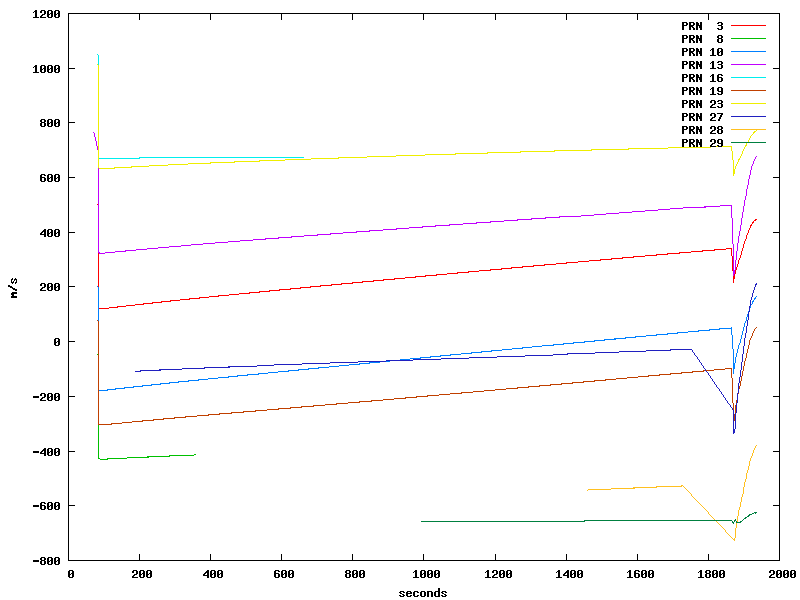
We also recorded some very interesting measurements from the GPS receiver. Each GPS satellite (identified by a "PRN", psuedo-random number sequence) is, of course, moving. The GPS receiver on the rocket measured the change in distance between the rocket and each satellite over time, effectively using the Doppler effect. Here's a plot of all measured relative velocities between the last power-on of the flight computer and the end of the 2005 flight.
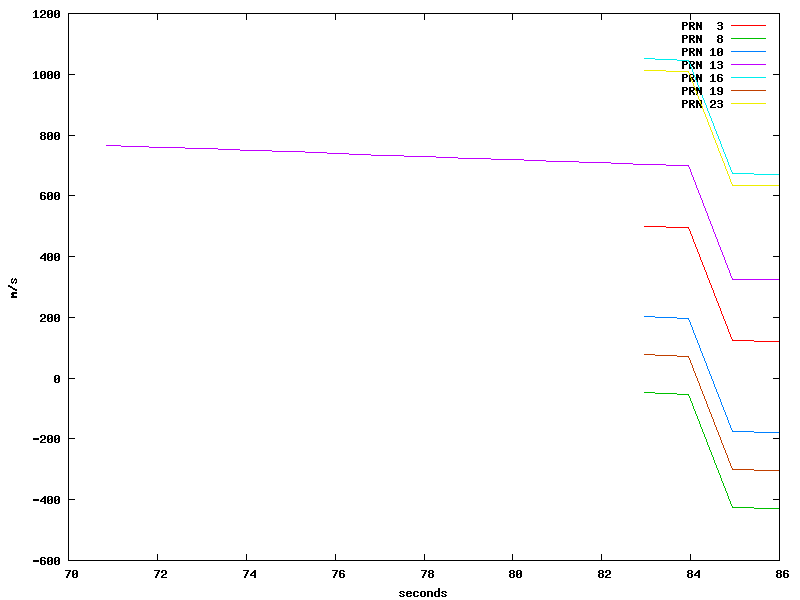
Here's the interval where the receiver was confused, during the satellite acquisition phase.
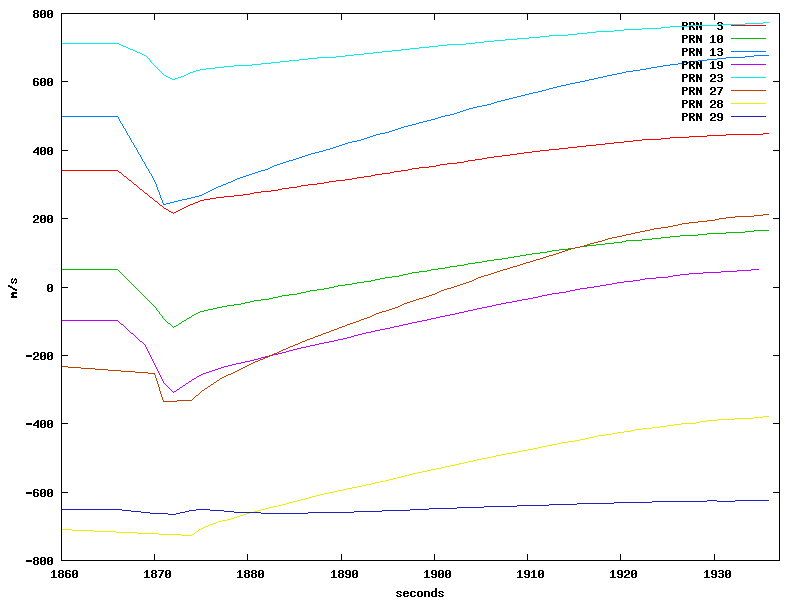
And here's the really interesting part—all measured relative velocities from just before the motor ignited until the end of the data.
Interpretation
The text dumps are filled mostly with lots of numbers, many of which have no useful units. This section documents how to interpret those numbers.
IMU
All IMU measurements (accel, gyro, pressure, and temperature) are reported in raw ADC values. You need calibration values for bias and gain for each sensor to get useful units from them. The value of a sensor is computed this way:
value = (raw - bias) / gain
| sensor | bias | bias error | gain | gain error | units |
|---|---|---|---|---|---|
| X | 2400.45 | .02 | 392.80 | 5.8 | G |
| Y | 2462.06 | .02 | 386.90 | 5.7 | G |
| Z | 1918.72 | .01 | 77.00 | 2.4 | G |
| Q | 1907.53 | .01 | 75.40 | 5.5 | G |
| pressure | -470.734 | ? | 44.549779924087175 | ? | kPa |
ImuCalibrationLV1b seems to be the source of some of the calibration data,but the format and testing conditions are not documented.
Future work
Larry originally proposed:
One of the things that everyone needs is data from previous flights of the Rocket. However, to get the data out requires hand-rolling scripts, and one off uses of grep. What I propose is to create a suite of tools that will take in a file (the logfile from our flight), crunch on the file, and create graphs and files of the various data that are needed. While we are still at the launch site.
The plan for this is to use whatever tools are appropriate. Perl, Haskell, whatever.
We have other telemetry data from past flights, and we expect to have more in the future. To the extent that these flights had similar sensors, it would be great to be able to use similar tools on those common subsets.