Metering Orifice Validation
Test series #1 -- 0.055" Orifice (2005.01.18)
For this test series we set the regulating valve to produce an orifice inlet pressure of 500psi. (We probably got closer to 300psi, see below.) The oxygen leaving the orifice was directed through a 25ft nominally 1/4" diameter hose and collected in a yellow plastic bag similar to a large garbage bag.
Since we didn't have an automated control, we videotaped the yellow handle on the pneumatically actuated valve to get accurate open-to-close times.
Once the gas flow stopped, the bag was sealed by rubber band and stuffed into a large blue plastic barrel and capped with a cardboard lid. By measuring the depth to which the lid descends, the bag's volume can be determined.
We ran the test 7 times leaving the pneumatically actuated valve open for various lengths of time between 3 and 20 seconds.
Data Gathered -- test series #1
| Run Number | Height1 (in) | Height2 (in) | Flow Time (s) |
|---|---|---|---|
| 1 | Data Invalid | ||
| 2 | 22 | 22.625 | 11.41 |
| 3 | 20.5 | 20.75 | 9.55 |
| 4 | 24.4375 | 24.5 | 6.04 |
| 5 | 28.5 | 28.875 | 2.57 |
| 6 | 17 | 17.375 | 14.03 |
| 7 | 11 | 11.1875 | 20.15 |
The measured temperature during the test was 62°F.
Portland international airport, Jan. 18th 2005 8:55pm :
- Elev. 23ft.
- 45.60N 122.60W
- 50°F
- 100% humidity, 48°F dew point
- Baro 30.21"Hg
- wind 12mph ESE
- 0" rain
For the purpose of calculating the gas density, we'll take the temperature as 62°F and the pressure as 30.21"Hg (16.6C, and 102.3kPa).
Using a tape measure, the outer circumference of the barrel was measured as 69.375in. and the wall thickness as 1/8in. The inner diameter of the barrel is therefore
- diameter = circumference/π - 2 * thickness
= 69.375in/π - 2 * 0.125in = 21.833in
The area we use to calculate the gas volume is
- area = π * diameter2 / 4
= 374.375in2
The measured wall height of the barrel at position 1 was 33.125in, and at position 2 it was 33.0625in.
The volume of gas in the yellow bag is calculated using the two measured heights and this formula
- volume = area * ((height1 - 33.125in)+(height2 - 33.0625in))/2
Applying the volume formula to the previous data table yields this table of volume versus time
Measured Volume Flow Rate -- test series #1
| Run Number | Volume (in3) | Flow Time (s) |
|---|---|---|
| 2 | 4036.23 | 11.41 |
| 3 | 4667.99 | 9.55 |
| 4 | 3228.98 | 6.04 |
| 5 | 1649.59 | 2.57 |
| 6 | 5954.9 | 14.03 |
| 7 | 8236.25 | 20.15 |
The volume versus time data fits well to a straight line. A least-squares fit returns this relation
- volume(in3) = 782.41 + 362.03 t
Where (t) is the flow time in seconds.
Here is a plot of the volume flow data together with the least-squares fit line for the 0.055" orifice 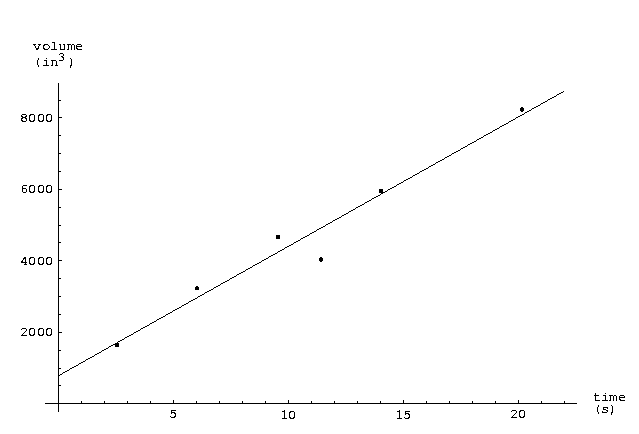
The fit is ok. The worst point is from run 2, and may be systematic error. Whatever, the accuracy is sufficient.
Using the least squares line the volume flow rate is 362in3/s.
The mass density of O2 at the conditions prevailing is found from the ideal gas law
- ρ = P / (R T) = 102.3kPa / (260 J/kg/K * 289.82K) = 1.358 kg/m3
Where (P) is the pressure, (T) the absolute temperature, and (R) the gas constant for oxygen (260 J/kg/K).
The mass flow rate is simply the volume rate times the density
- dm/dt = ρ * 362in3/s * (25.4*10-3m/in)3 = 8.05 g/s
The design flow for this orifice is 22g/s at 1000psi inlet pressure.
The measured flow is only 8g/s at 500psi.
All else being equal, the mass flow should be proportional to the inlet pressure. However, even doubling the measured flow rate to 16g/s the flow is still 27% too low.
27% is too much error, something is wrong.
During the subsequent tests of the 0.089" orifice we determined that the regulating valve actually produced closer to 303psi when set at 500psi. If this was also true for this first test series, the expected flow at 1000psi would be
- dm/dt = 8.05 g/s * 1000psi/303psi = 26.57 g/s
The theoretical flow rate is about 22.14 g/s, so this orifice appears to be providing 20% too much gas. This is a little more error than we would like, we need to look into this more.
Test series #2 -- 0.089" Orifice (2005.01.27)
Since we had to change the orifice plate for this test we measured both orifices. They are both 0.750" in outer diameter. The 0.055" orifice is 0.118" thick. The 0.089" orifice is 0.2475" thick.
We put the test computer back together for this test series so we were able to log orifice inlet and outlet pressure and get accurate run times from the computer data.
As suspected, the regulating valve's outlet pressure drops suddenly as the flow increases. The good news is that the regulation is fairly good, with no large pressure fluctuations a few hundred milliseconds after the flow starts.
We checked the airport again. The barometric pressure was 29.90Hg". The temperature in the shop rose somewhat throughout the evening, but we are using the middle value of 60°F.
We did 5 runs with run times between 2 and 8.3 seconds. The run time on the valve was determined by the zero-crossing of the inlet pressure transducer (which exhibited a slight negative offset of a few psi). The pressure data was sampled at 2ms intervals (500 samples per second).
Data Gathered -- test series #2
| Run Number | Height1 (in) | Height2 (in) | Start Bin | End Bin | Inlet (psi) | Outlet (psi) |
|---|---|---|---|---|---|---|
| 1 | 8.75 | 8.5 | 1420 | 5528 | 305 | 132 |
| 2 | 16.875 | 16.75 | 1392 | 4404 | 305 | 132 |
| 3 | 20.125 | 19.875 | 1537 | 3754 | 302 | 131 |
| 4 | 26.75 | 26.625 | 1895 | 2945 | 301 | 129 |
| 5 | 12.0 | 11.875 | 1378 | 5296 | 300 | 129 |
Since test #2 uses the same apparatus, we use the same volume conversion formula as was used in test #1, the new data converted to volume flow measurements yields the following table
Measured Volume Flow Rate -- test series #2
| Run Number | Volume (in3) | Flow Time (s) |
|---|---|---|
| 1 | 9160.49 | 8.216 |
| 2 | 6095.29 | 6.024 |
| 3 | 4901.97 | 4.434 |
| 4 | 2398.34 | 2.100 |
| 5 | 7920.37 | 7.3836 |
The least squares fit line to this data is
- volume(in3) = 178.0 + 1034.1 t
Here is a plot of the data along with the best fit line for the 0.089" orifice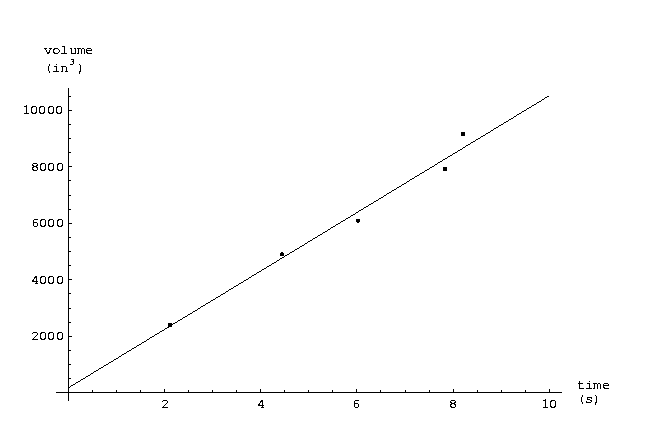
This line doesn't seem as nice as the first test run, but it's ok. Possibly the extra difficulty in handling the higher flow rate, or the inability to run for longer times without overfilling the yellow bag caused more systematic error.
Proceeding as before, The density of O2 for the conditions in the shop that day works out to
- ρ = P / (R T) = 101.25kPa / (260 J/kg/K * 288.71K) = 1.349 kg/m3
The mass flow rate is therefore
- dm/dt = ρ * 1034.1 in3/s * (25.4*10-3m/in)3 = 22.86 g/s
The theoretical flow for this orifice at 60°F and 1000psi inlet pressure is 58.1g/s .
Using the average inlet pressure of 302.6psi and scaling the measured flow rate to 1000psi gives
- dm/dt = 22.86 g/s 1000psi/302.6psi = 75.5 g/s
This is over the theoretical value by 30%, that's too high.
The first test series using the 0.055" orifice also produced a flow rate that was too high, though by only 20%. At this point i wonder if the pressure transducer is giving an accurate reading. It seems reasonable to expect the measured values to be within 10% of the theory, 30% is just too high.
As an interesting side bar, the orifice outlet pressure during test series #2 was around 120psi. After finishing test series #2 we removed the 25ft hose and measured the the orifice outlet pressure, which dropped to about 11psi. So it looks like the pressure drop in the hose is substantial. During motor tests we use a hose of very similar diameter to connect the orifice outlet to the motor, but that hose is only 3ft long, so we think we're ok.
Attachments: