Attendees: AndrewGreenberg, Tim Brandon, ?JameySharp, ?MarkusWeltin, Tim Menzies
Markus is taking ECE 457 Engineering Data Analysis and Mining. For that class he has to do a project, and of course we have lots of engineering data to analyze and mine. The first agenda item for this meeting was to work out a project definition that would satisfy the requirements of the class and also be useful to us.
Also, Markus told a joke. Variants of it may be found here (the first number 4) and here (labeled "More Poles").
Markus had a test to study for and took off. A short while later, Tim Menzies finished his lecture in his CS 510 Data Mining class, and we chatted with him for a few minutes.
Andrew, Tim Brandon (henceforth "Tim"), and Jamey continued until about 4am.
We particularly wanted to review Jamey's prototype GAINS implementation, and spent some time on that.
The prototype, following Andrew Paul's lead, computes the integral of rotational velocity by this algorithm:
- multiply each component of the sample by delta-T.
- compute a rotation matrix expressing a rotation by each of the components.
- multiply the previous orientation matrix by this matrix.
A lot of discussion went into the question of whether that last multiply was really playing the role of the addition that occurs when integrating. Eventually Tim agreed that at least it wasn't obviously wrong. (At least I think that's what he concluded. -- ?JameySharp)
Tim expressed concerns about a certain inaccuracy in this model. Under certain circumstances, recieving a constant measurement over several gyro samples means not that the rocket is rotating through a flat plane, but rather that it's rotating through a cone. Tim is trying to come up with an example that makes this clear.
Tim complained about inconsistent coordinate systems (we have several) and outlined the one he wants.
We made minimal tests of the GAINS prototype's handling of rotation, and established a few small things:
- When rotational velocity is 0 in all axes, the prototype does change the orientation of the modeled rocket. (good!)
- When rotational velocity is 90 degrees/second for one second around an axis other than Z, the rocket winds up on its side. (good!)
- The prototype believes that the rotational axis around Z is called pitch. (bad!)
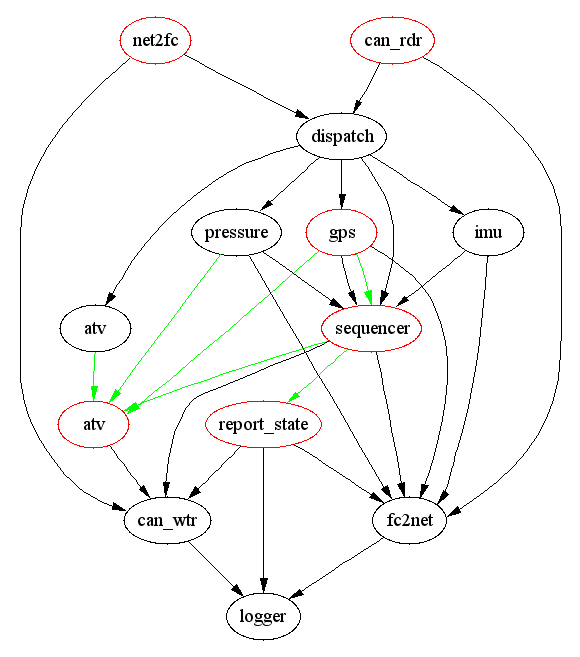
Jamey spent a while explaining the current flight computer software architecture. Here's the data-flow diagram. (Whiteboard photos: 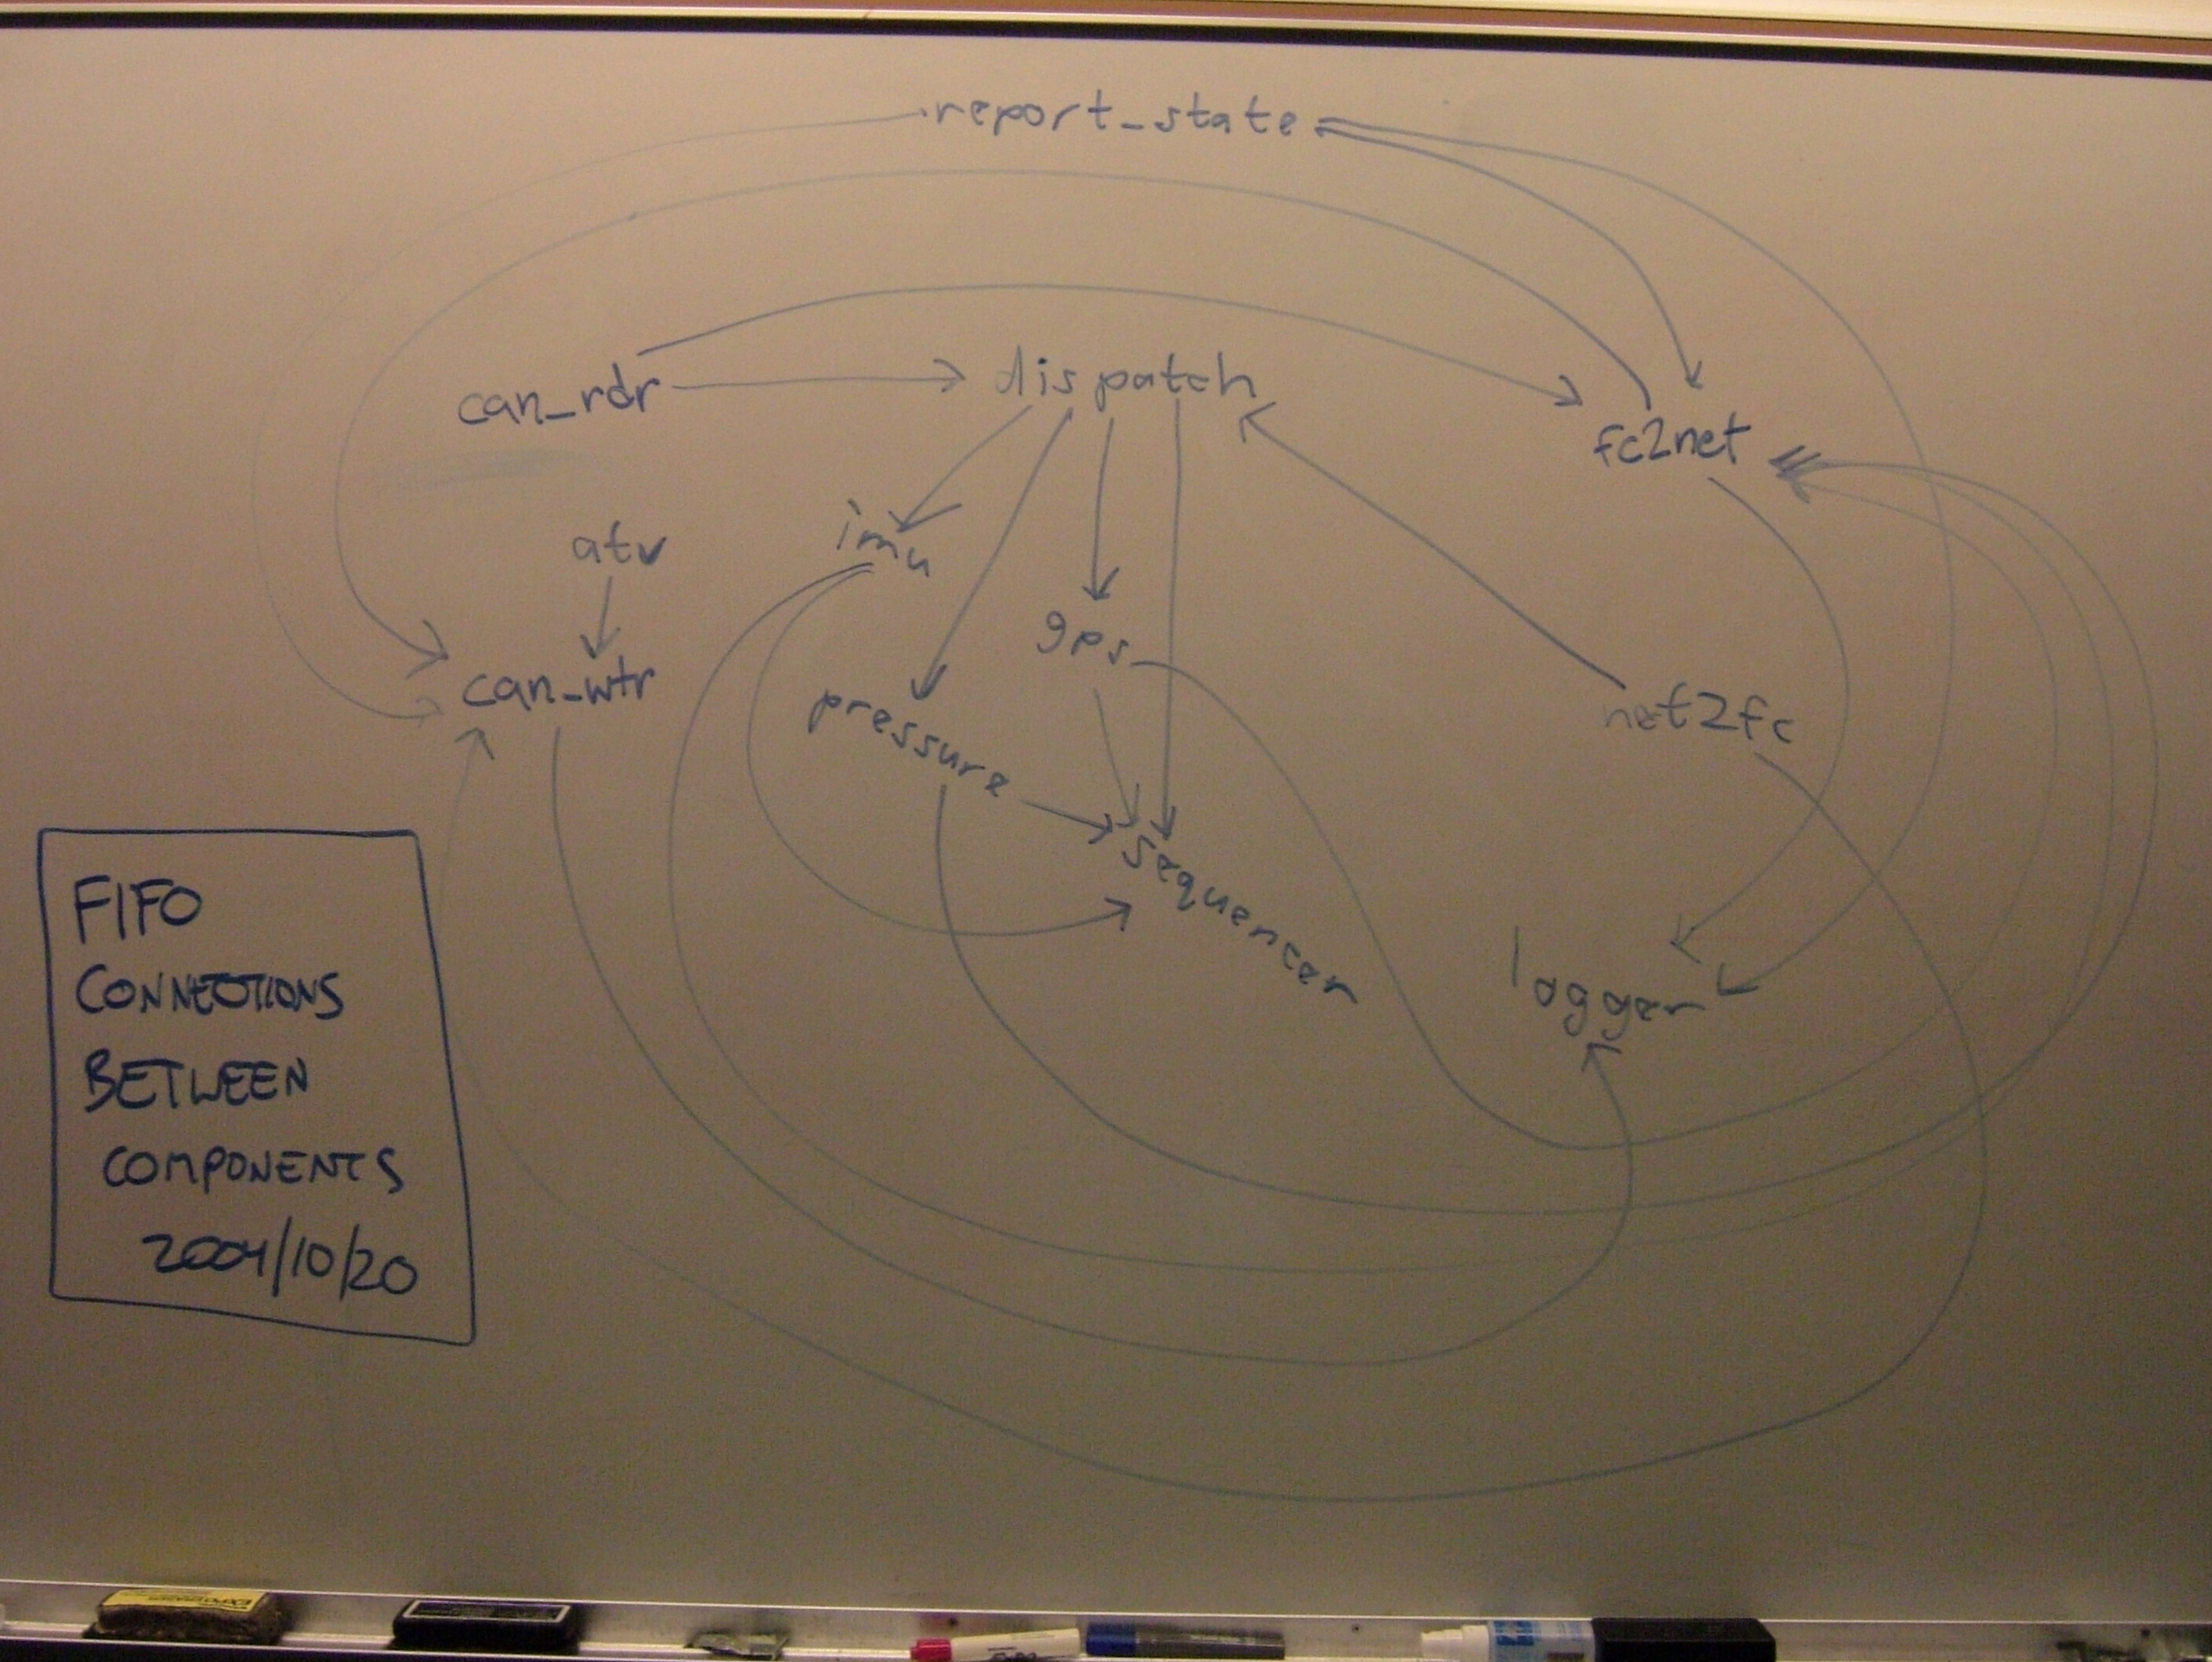 (1.4Mb),
 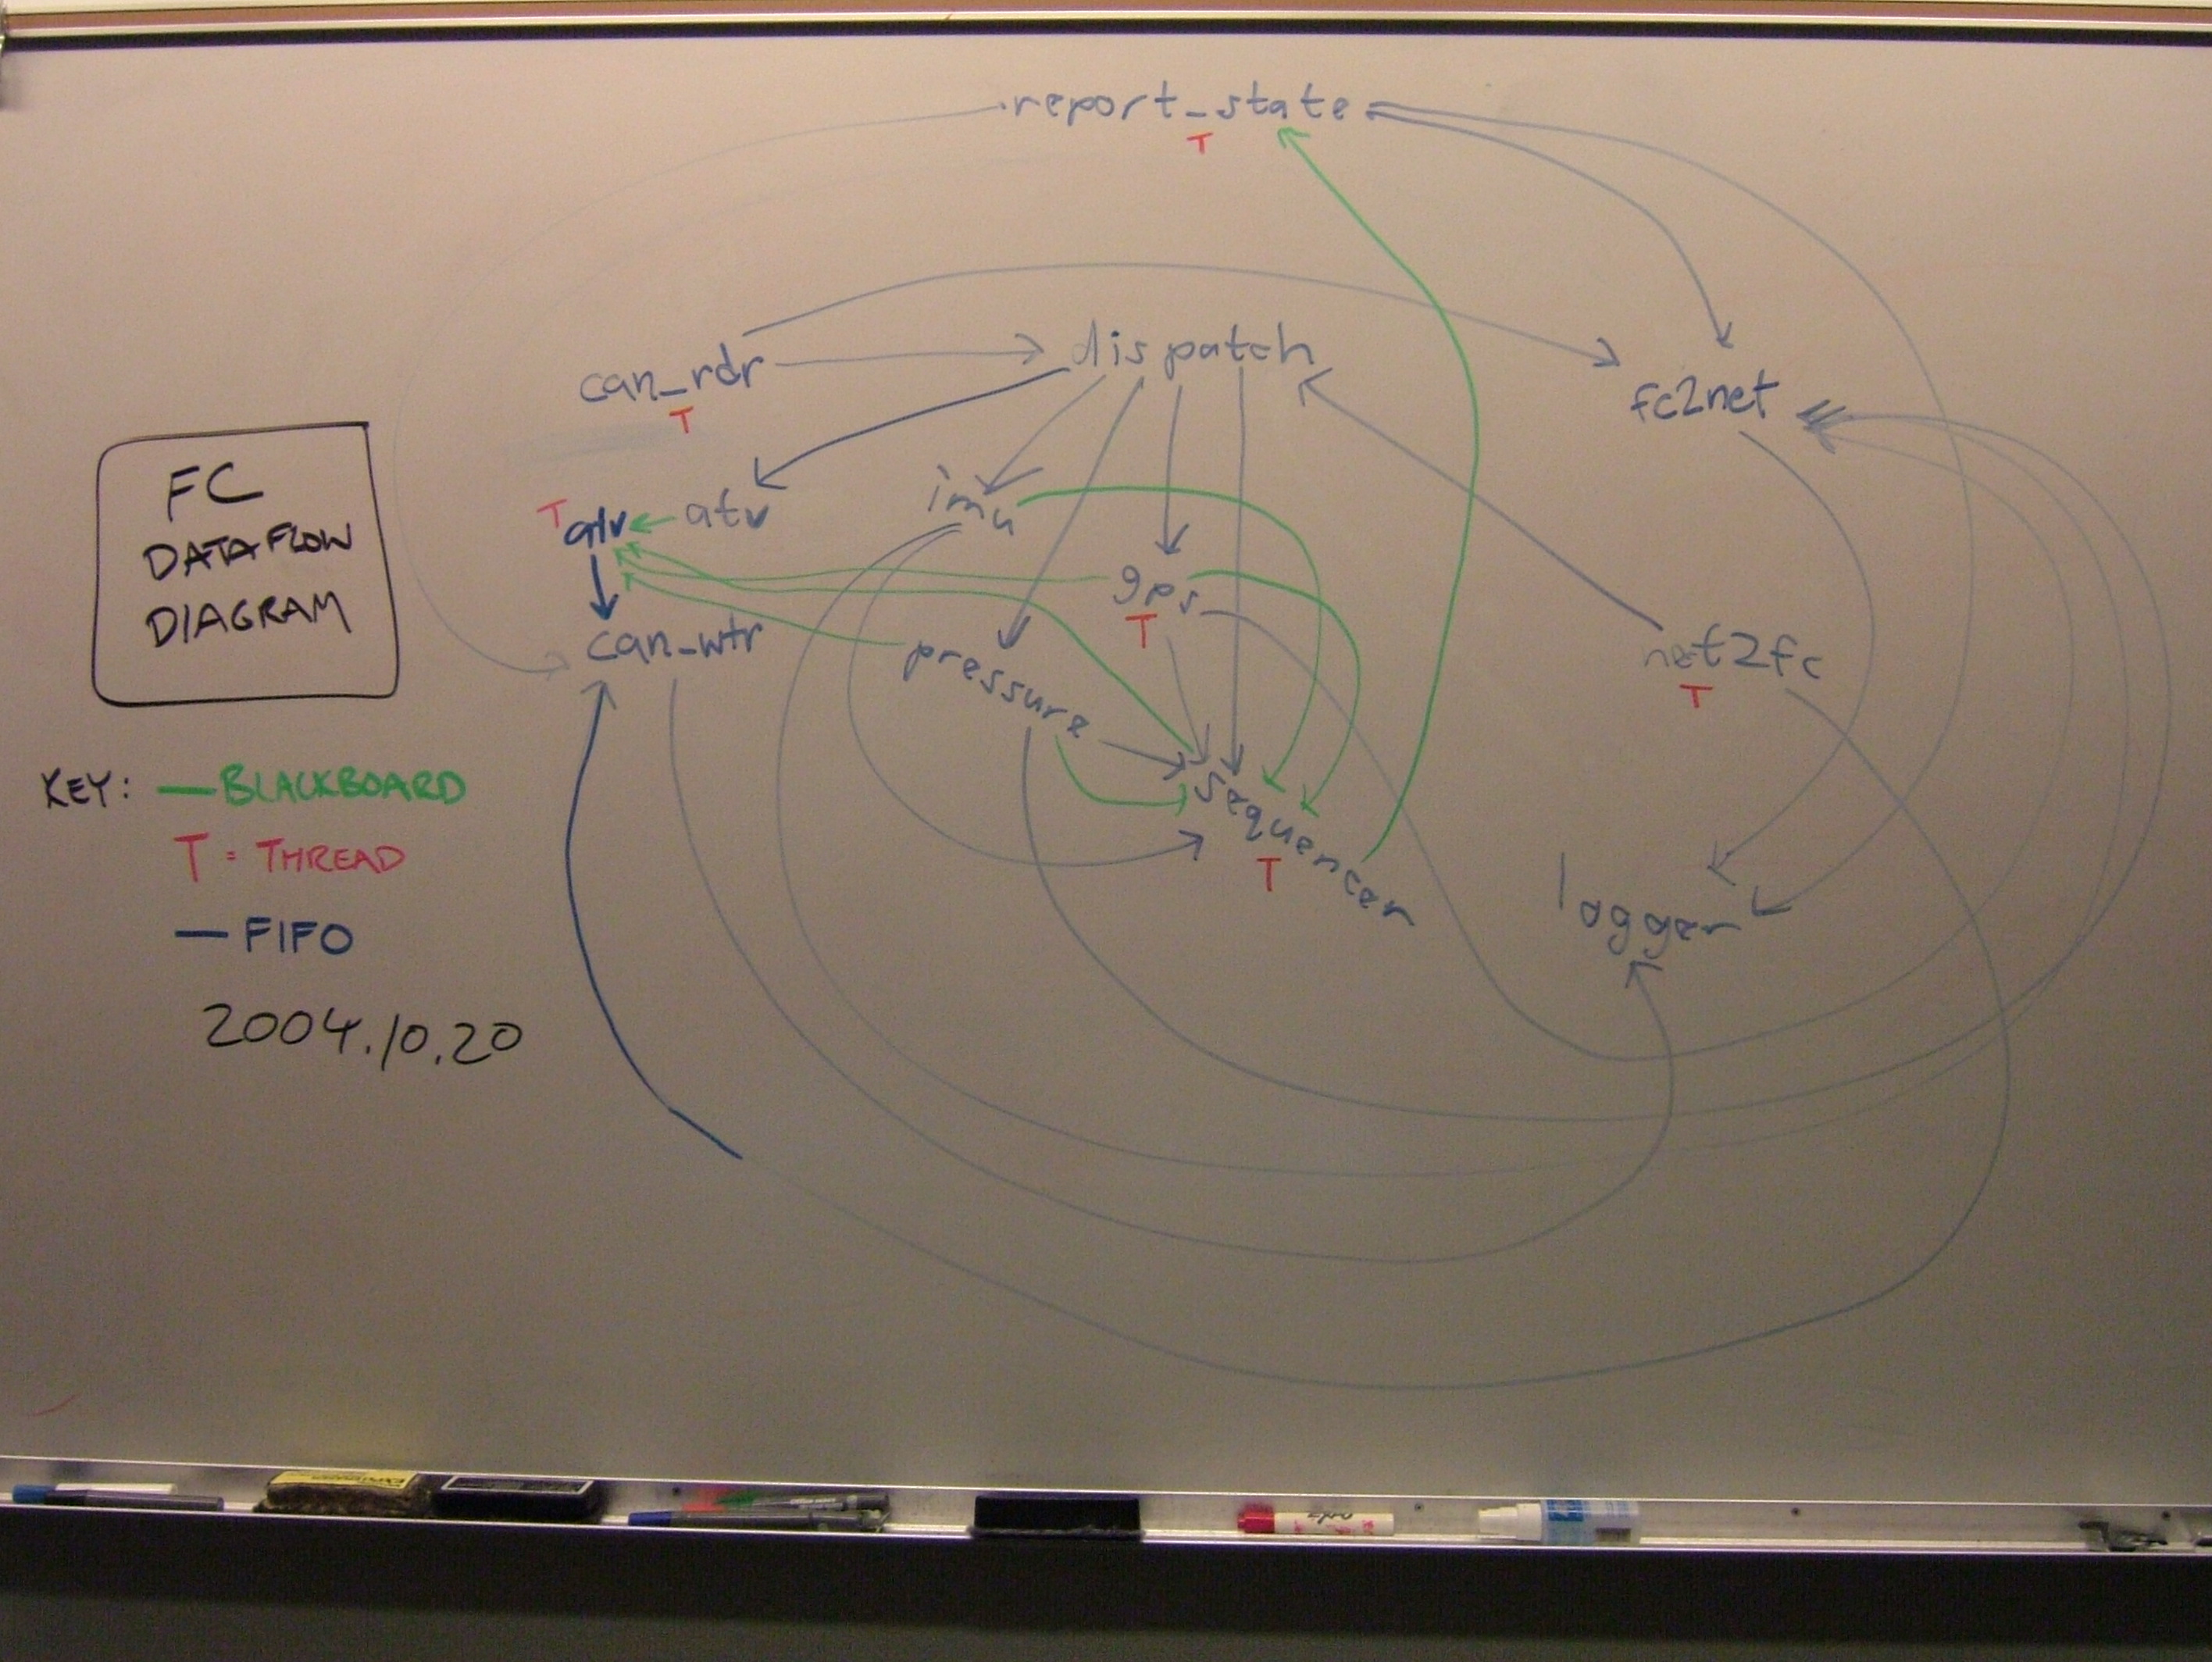 (1.4Mb).) Black arrows represent FIFO message writes; green arrows represent data flow over the blackboard. Components in red circles get their own threads, while components in black circles execute in whichever thread wrote messages to them.
Attachments: